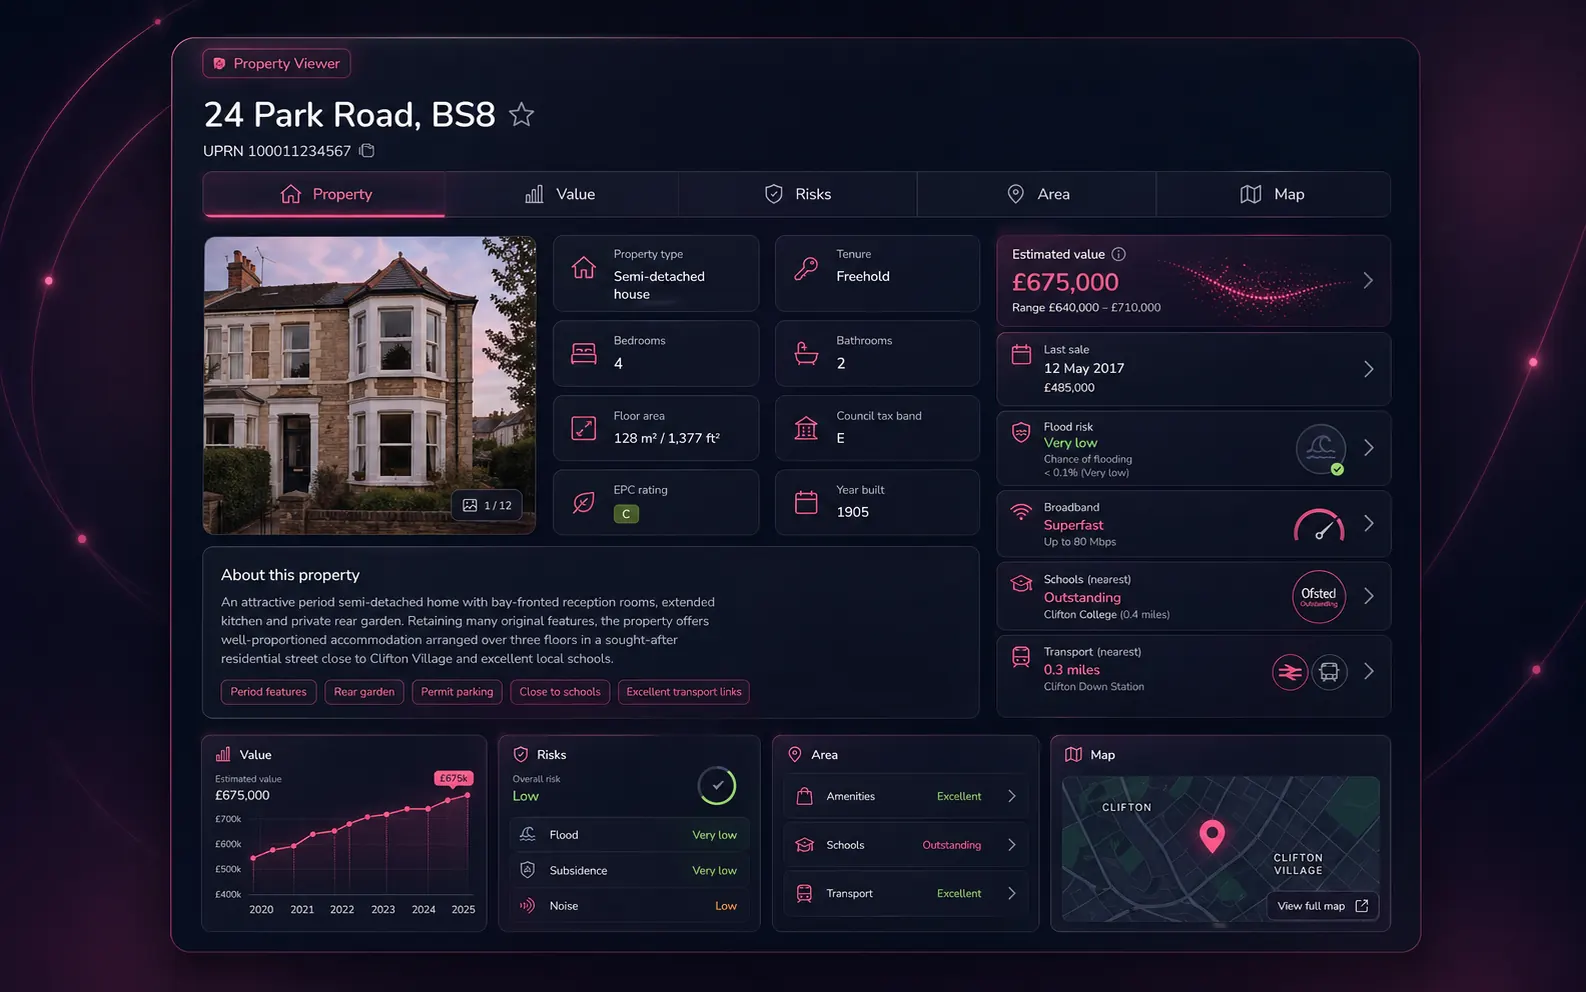
Look it up. Know it before you go.
Search any UK address. We resolve it to a UPRN and instantly surface 80+ data points across five tabs: 24 property characteristics, EPC + renovation cost, broadband, AI-predicted value, full sale and rental history, environmental risks, invasive plants, IMD prosperity by seven domains, MapSentry AI risk analysis, comparables, air pollution, crime over 1.5 miles, and 12 amenity layers on the map. Quote with confidence. Pre-flight a survey. Catch the surprises before you turn up at the door.
Why pre-survey
The 60 seconds that save the job.
Most surveyors learn about Japanese knotweed at the front gate, the radon zone after the inspection, or the leasehold complications after the report goes out. Property Viewer flips that round: every red flag the public data layer knows about is on screen before you commit to a quote.
Quote with confidence
See EPC, floor area and current listing status before you write a fee. No more under-pricing a Level 3 because the property turned out to be 50% larger than the directory listing claimed.
Pre-flight the inspection
Know about flood zones, radon levels, mining history and conservation status the day before you arrive. Pack the right kit, brief the trainee, set the right expectations with the client.
Catch the surprises
Japanese knotweed within 50 m? Historical landfill within 250 m? Active subsidence claim in the postcode? All flagged with severity and distance, with a clear "intersects property" callout when the hazard sits on the boundary.
What's surfaced
Five tabs. 80+ data points per UPRN.
The dashboard is split into five tabs across the top of the screen — Property, Value, Risks, Area and Map. Here's everything that lives in each one.
Property
24 fields per UPRN
- ● UPRN + full address + postcode
- ● Property type
- ● Bedrooms (with AI prediction where unknown)
- ● Bathrooms
- ● Habitable rooms
- ● EPC floor area (m²)
- ● Building height (m)
- ● Geometry footprint area (m²)
- ● Land area (m² and acres)
- ● Construction age band
- ● Number of floors
- ● Windows type
- ● Extensions
- ● Construction material
- ● Roof material
- ● Has garden + garden details
- ● Has parking + parking details
- ● Land Registry estate interest (freehold / leasehold)
- ● Land Registry title class
EPC + renovation cost
- ● Current EPC rating (A–G)
- ● Current energy efficiency score (0–100)
- ● Potential EPC rating
- ● Potential energy efficiency score
- ● Last EPC certificate date
- ● Recommended improvements list
- ● Estimated renovation cost (minimum)
- ● Estimated renovation cost (maximum)
- ● Estimated renovation cost (mid-point)
- ● Per-improvement cost breakdown
Four tiers · down + up
- ● Standard broadband download Mbps
- ● Standard broadband upload Mbps
- ● Superfast download Mbps
- ● Superfast upload Mbps
- ● Ultrafast download Mbps
- ● Ultrafast upload Mbps
- ● Maximum predicted download Mbps
- ● Maximum predicted upload Mbps
- ● FTTP / FTTC availability
Value
Current market value, modelled per UPRN
- ● Predicted current market value (£)
- ● Confidence indicator
- ● Adjusted for property-specific characteristics, not just postcode average
- ● Useful sanity-check against the comparable tool's weighted range
Every Land Registry transaction we hold
- ● Full sale history list (date, price, transaction type)
- ● Sale summary card (most recent, latest event)
- ● First-listing date and days-on-market
- ● Stale-listing detection
- ● Off-market vs on-market status
Visualised over time
- ● Chronological chart of every sale
- ● Price trajectory across decades of ownership
- ● Useful for spotting flips, refurbishments and long-tenure holdings
For investment-property work
- ● Historical rental listings for the UPRN
- ● Rent trajectory over time
- ● Lettings vs sale activity at the property
Risks
Severity-coded grid with distances
- ● Flood — rivers and sea
- ● Surface water flooding
- ● Subsidence
- ● Radon
- ● Mining / historical excavation
- ● Landfill (active and historical) — with "property on landfill" warning
- ● Traffic noise
- ● Train noise
- ● Conservation-area constraints
- ● Contaminated land
Each risk shows distance (or "intersects property"), severity verdict and a description.
7 species mapped with origin
- ● Japanese knotweed (origin: Japan) · flagged critical
- ● Giant hogweed (origin: Caucasus) · flagged critical
- ● Himalayan balsam (origin: Himalayan region)
- ● Rhododendron ponticum (origin: Spain / Portugal)
- ● Floating pennywort (origin: North America)
- ● New Zealand pygmyweed (origin: New Zealand)
- ● Cotoneaster (origin: China)
"Not detected" species are also shown (greyed out) so you have a full audit of what's been checked, not just what was found.
Live air-quality index
- ● Today's air-quality reading at the property
- ● Severity verdict and short-term forecast
- ● Useful context for properties near major roads, motorways or airports
data.police.uk · 1.5-mile radius
- ● Crime list within a 1.5-mile circle around the property
- ● Single-month or multi-month requests (e.g. last 12 months)
- ● Categorised (anti-social, burglary, violent, vehicle, drugs, theft and more)
- ● Geo-coordinates so each crime can be plotted on the map
Area
IMD · 7 domains
- ● Income
- ● Employment
- ● Education, skills & training
- ● Health deprivation & disability
- ● Crime
- ● Barriers to housing & services
- ● Living environment
Each domain shows a sub-score, plus an overall IMD ranking for the LSOA.
AI-powered area risk analysis
- ● Written narrative analysis of the area's combined risks
- ● Synthesises environmental, prosperity, crime and pollution into a single brief
- ● Saves you reading every tab in turn
Recent sold comps within radius
- ● Sold-comp list with address, date, price
- ● Bedrooms and property-type filtering
- ● Direct link into the dedicated Comparable Tool for weighted valuation
Map
12 toggleable categories
Toggle individual layers on the map; each amenity is plotted as a colour-coded pin.
Footprint & coordinates
- ● Property footprint polygon
- ● Land Registry title polygon (where available)
- ● Lat / long coordinates
- ● Crime pins (within 1.5 mi)
Per UPRN
Severity-coded
Every risk gets a clear verdict.
No raw scores. Every environmental and property risk is normalised into a four-state verdict you can paste straight into a client summary.
No identified risk in the area or hazards are far from the property
Hazard exists in the wider area at moderate severity or distance
Significant hazard severity in the immediate area
Hazard intersects the property or sits within a stated radius
How it fits the toolkit
From lookup to report, with no re-typing
Look up the property in Property Viewer
Search by address, postcode or UPRN. The dashboard loads in seconds; the result is cached for an hour so re-opens are instant.
Quote, schedule, brief the team
Use the dashboard to scope the job — energy renovation, flood risk, invasive plants, conservation status all factor into your fee and your kit list.
Open the report — the data is already there
When you create the Level 2 or Level 3 report for the same UPRN, the Property Data Drawer opens with the same EPC, risks and listing data ready to copy into Section C — and Otto auto-mode uses it to synthesise Section C automatically.
FAQ
Property Viewer FAQs
What is the Property Viewer?
A pre-survey intelligence dashboard for UK RICS surveyors. Search any UK address and we resolve it to a UPRN, then surface 80+ data points across five tabs: Property (24 characteristics + EPC + broadband), Value (AI-predicted value, sale and rental history), Risks (environmental risks, invasive plants, air pollution, crime), Area (IMD prosperity by 7 domains, MapSentry AI, comparables) and Map (12 amenity layers). Everything you need to scope a job, write an accurate quote, or pre-flight a survey before you ever set foot on the property.
What property characteristics are shown?
Twenty-four characteristics: UPRN, full address, property type, bedrooms (with AI prediction where unknown), bathrooms, habitable rooms, EPC floor area, building height, geometry footprint area, land area in m² and acres, construction age band, number of floors, windows type, extensions, current EPC rating, construction material, roof material, has-garden flag plus garden details, has-parking flag plus parking details, Land Registry title class and estate interest (freehold / leasehold).
Which environmental risks are checked?
Flood (rivers, sea and surface water), subsidence, radon, mining and historical excavation, landfill, traffic noise, train noise, conservation-area constraints and contaminated land. Each risk is shown with a verdict from our 10-step severity scale (Urgent, Extreme, Very High, High, Medium-High, Medium, Moderate, Low-Medium, Low, Not detected) and a distance — including a clear callout when the hazard intersects the property boundary or when the property sits on a landfill site.
Are invasive plants covered?
Yes. We map seven species: Japanese knotweed (origin Japan), giant hogweed (Caucasus), Himalayan balsam (Himalayan region), rhododendron ponticum (Spain / Portugal), floating pennywort (North America), New Zealand pygmyweed (New Zealand) and cotoneaster (China). Each is shown with severity and distance. Japanese knotweed and giant hogweed are flagged as critical risks with extra warning treatment.
What value information is shown?
An AI-predicted current market value with a confidence indicator, the full sale history (every Land Registry transaction we hold for the UPRN), a sale summary card, a sales timeline visualisation and a rental timeline visualisation. The AI prediction adjusts for property-specific characteristics rather than just averaging the postcode.
What does the Area tab cover?
Index of Multiple Deprivation across all seven domains (income, employment, education, health, crime, barriers to housing, living environment), MapSentry AI which produces a written narrative risk analysis of the area, comparable properties within radius, and air pollution today as a live air-quality index. The Map tab adds 12 amenity layers — schools, universities, restaurants, pubs, supermarkets, corner stores, hospitals, GPs, pharmacies, green spaces, bus stops and train stations.
What about crime data?
Crime data is pulled from data.police.uk over a 1.5-mile radius around the property. Single-month and multi-month requests are both supported, so you can pull a 12-month rolling crime picture for the area or focus on a specific recent month for a current-day brief.
Where does the data come from?
From the same UPRN-keyed property database that powers home.co.uk's public sold-prices, rental-prices and property-detail pages. EPC comes from the OpenData EPC register. Land Registry sold-prices come from HM Land Registry Price Paid Data. Title and tenure come from Land Registry title data. Crime comes from data.police.uk. Deprivation comes from the official Index of Multiple Deprivation. Air pollution comes from real-time UK air-quality data.
How is this different from the Property Data Drawer?
The Property Viewer is a standalone dashboard you visit before you create a report — for quoting, pre-flight checks and prospect research. The Property Data Drawer is a compact panel version of the core data, embedded inside every Level 2 and Level 3 report editor so you can reference EPC, risks and comparables while you write.
Is there a token cost per lookup?
Lookups are paid in tokens from your firm's balance. Tokens are inexpensive and bundled with every paid subscription tier. The first lookup on any property is the most expensive (we cache the result for an hour), so re-opening the same property within the cache window costs nothing.
Do you cover the whole of the UK?
Yes — England, Scotland, Wales and Northern Ireland are all covered. Coverage of individual data layers varies by region (for example, EPC certificates exist for properties that have had one issued); the dashboard tells you clearly when a layer has no data for the subject.
Can I export a Property Viewer dashboard?
You can copy individual sections into a quote or a report. A standalone PDF export of the whole dashboard is on the roadmap; in the meantime, the data flows automatically into the Section C auto-populator inside the Level 2 / Level 3 report writer.
More tools
Explore the rest of the surveyor toolkit
Otto
AI auto-mode RICS report writer
Dictate on-site, upload photos, get a finished, fully-routed Level 2 or Level 3 report in minutes.
Level 2 Report Writer
RICS Home Survey Level 2
Field-by-field RICS Level 2 reports with inline AI suggestions, image gallery, comparables and one-click branded PDF.
Level 3 Report Writer
RICS Building Survey Level 3
Comprehensive Level 3 Building Survey reports with deep technical sections, custom rating scales and AI legal-adviser notes.
Surveyor Comparable Tool
Sold + rental comps in one click
Auto-fetch sold and rental comparables within a 1-mile radius, weighted valuation range, branded PDF appendix for any survey.
Snagging Report Builder
New-build defect tracker
Build professional new-build snagging lists with location-based defect tracking, photos, urgency, status and PDF export.
AI Dictation
Voice-to-fields routing
Speak observations on-site; AI routes every sentence to the correct RICS field with confidence scores and replayable audio.
Image AI
Auto-categorise survey photos
Upload up to 200 photos; vision AI tags each to the right RICS element, rates condition, extracts defects and picks the best 35 for the report.
Style Profile
Your firm's writing fingerprint
Teach the AI to write like your firm — upload past reports, the AI extracts a 25-dimension writing fingerprint and applies it to every future auto-mode report.
Property Data Drawer
EPC + risks + comps in one panel
Open the property data drawer in any report to see EPC, environmental risks, listing history and comparables — copy-paste ready.
Standard Phrases
Reusable language library
Personal, firm-wide and industry-preset phrase libraries — insert with one click and use to train AI routing for voice consistency.
RICS Standards Check
Home Survey Standard compliance pass
One-click AI compliance pass against the RICS Home Survey Standard — flags missing content, weak ratings and structural gaps before you sign the report.
Free directory listing. Pay-as-you-go toolkit.
Every RICS-regulated surveying firm gets a verified profile, direct bookings from home.co.uk consumers and the surveyor toolkit included with the account. No subscription. No pay-per-lead. No commission on the job. Pay only when you use the premium AI tools.
2 minute setup · Verified against the RICS register · Trusted UK property platform since 1995